Today we’re going to talk about How To Trade Falling and Rising Wedge Pattern. There are mainly two types of Wedge Pattern 1, Falling 2,Rising. here, we had mentioned the steps regarding how we can trade Wedge
Falling Wedge Pattern
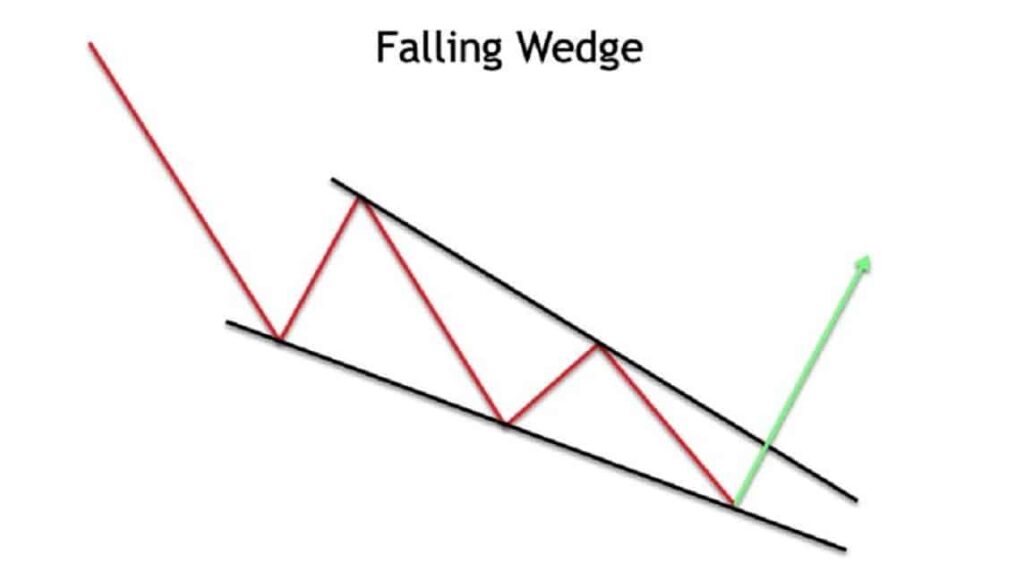
A falling wedge pattern is a technical analysis chart pattern that occurs in a downtrend and is characterized by a converging price range with lower lows and lower highs.
The pattern is created by two downward sloping trend lines that are moving closer together, forming a “wedge” shape.
The falling wedge pattern is considered a bullish reversal pattern, as the trend lines are moving closer together, indicating that the selling pressure is diminishing and a potential trend reversal may occur.
When the price breaks out above the upper trend line, it is considered a confirmed falling wedge pattern and signals a potential for the price to continue to rise.
However, it’s important to keep in mind that chart patterns are not a guarantee of future price movements and should be confirmed with other technical indicators, such as volume or momentum indicators.
Rising Wedge Pattern
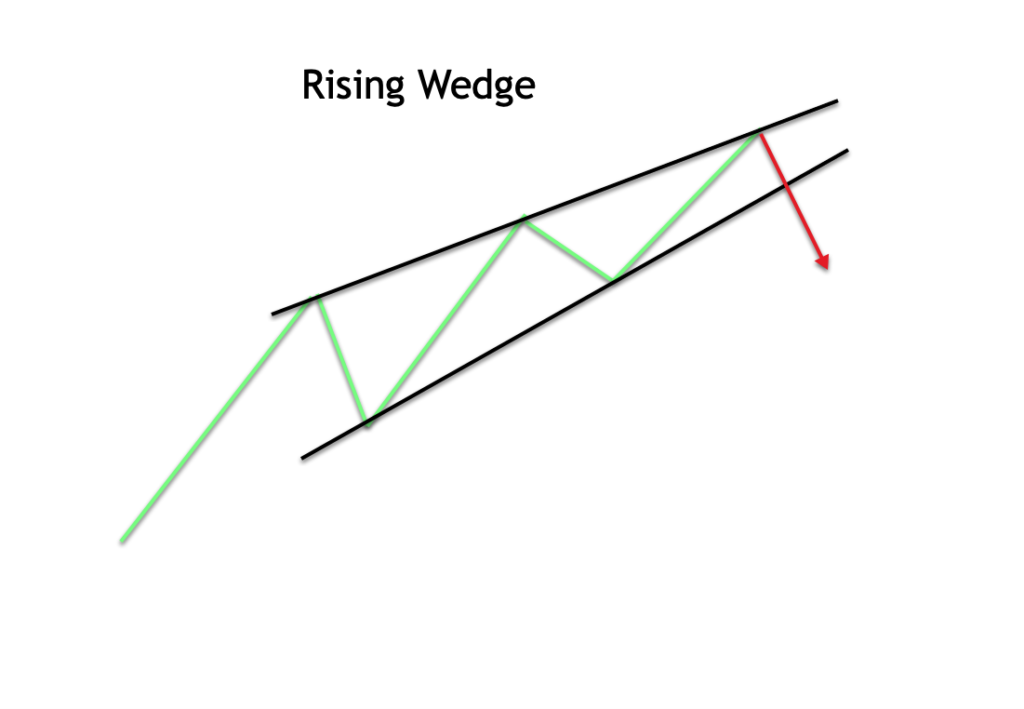
A rising wedge pattern is a technical analysis chart pattern that is used to identify trend reversals in a stock’s price movement.
It is formed by two upward sloping trendlines that converge towards each other, creating a wedge shape. The trendlines are formed by connecting a series of higher highs and higher lows in the price movement of a stock.
Typically, a rising wedge pattern signals a bullish trend reversal, meaning that the stock price has been increasing but is likely to start decreasing in the future.
The pattern is considered bearish because the converging trendlines imply that the buying pressure behind the stock is decreasing, and that sellers are starting to gain control.
However, it is important to keep in mind that rising wedge patterns are not always a reliable indicator of a trend reversal, and should be confirmed by other technical analysis indicators and market data before making any investment decisions.