Today we’re going to discuss about What is Ascending and Descending Channels pattern in Trading ?
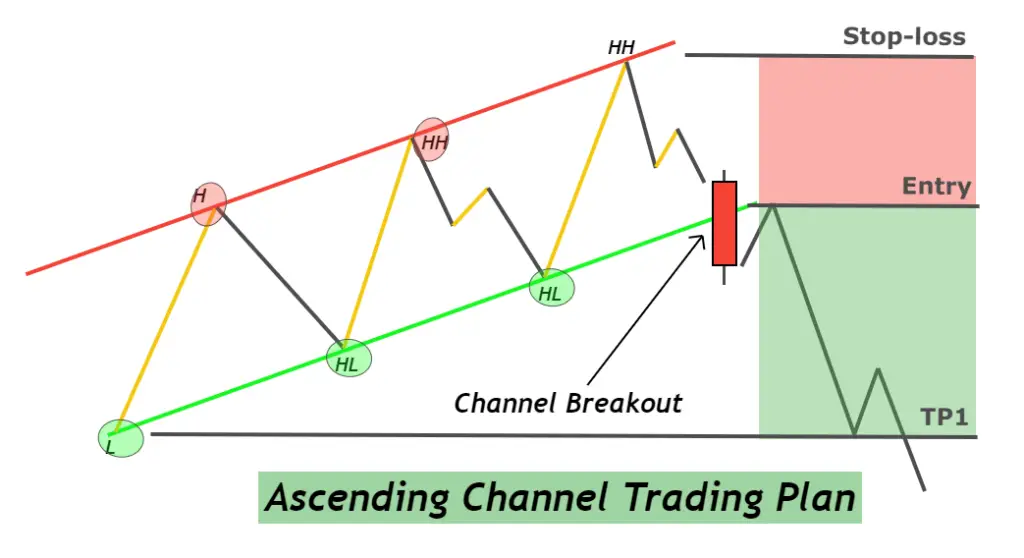
Ascending Channel Pattern
An ascending channel pattern is a bullish technical analysis chart pattern that appears on price charts.
It is formed when a stock or other asset is moving higher in price and the trading range is defined by two upward sloping trendlines, one serving as the support level and the other as the resistance level.
The pattern is considered a bullish signal and suggests that the price of the asset is likely to continue rising until it reaches the upper trendline resistance.
Traders often use this pattern to identify potential buying opportunities, as well as to set stop-loss levels and profit targets. However, it’s important to note that no chart pattern is a guarantee of future price movements, and it’s always important to consider other technical and fundamental factors when making investment decisions.
What is Descending Channel pattern in Trading ?
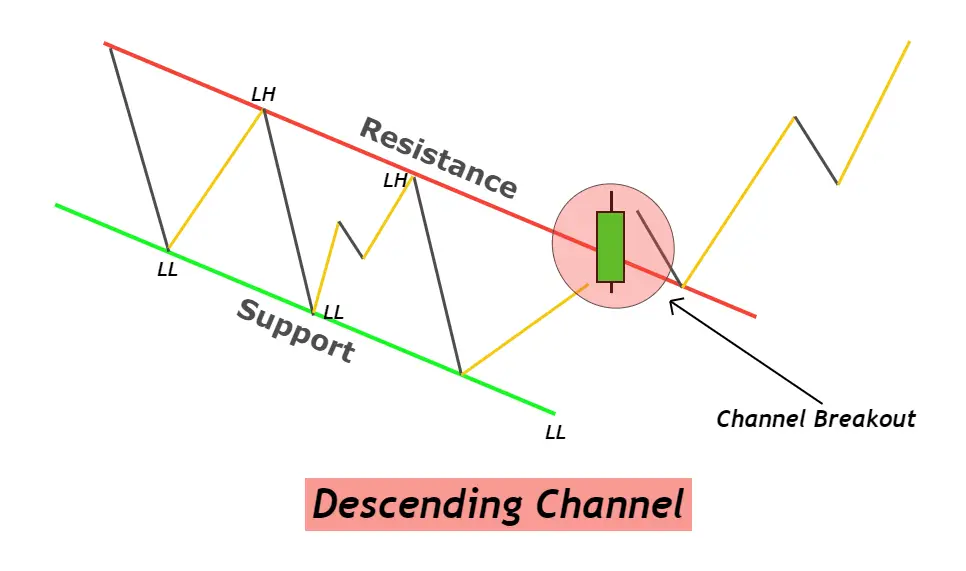
Descending Channel Pattern
A descending channel pattern is a bearish technical analysis chart pattern that appears on price charts.
It is formed when a stock or other asset is moving lower in price and the trading range is defined by two downward sloping trendlines, one serving as the resistance level and the other as the support level.
The pattern is considered a bearish signal and suggests that the price of the asset is likely to continue falling until it reaches the lower trendline support.
Traders often use this pattern to identify potential selling opportunities, as well as to set stop-loss levels and profit targets. However, it’s important to note that no chart pattern is a guarantee of future price movements, and it’s always important to consider other technical and fundamental factors when making investment decisions.