Today we’re going to talk about How To Trade Bullish And Bearish Flag Pattern. There are mainly two types of Flags 1, Bullish 2, Bearish. here, we had mentioned the steps regarding how we can trade Flags.
Bullish Flag Pattern
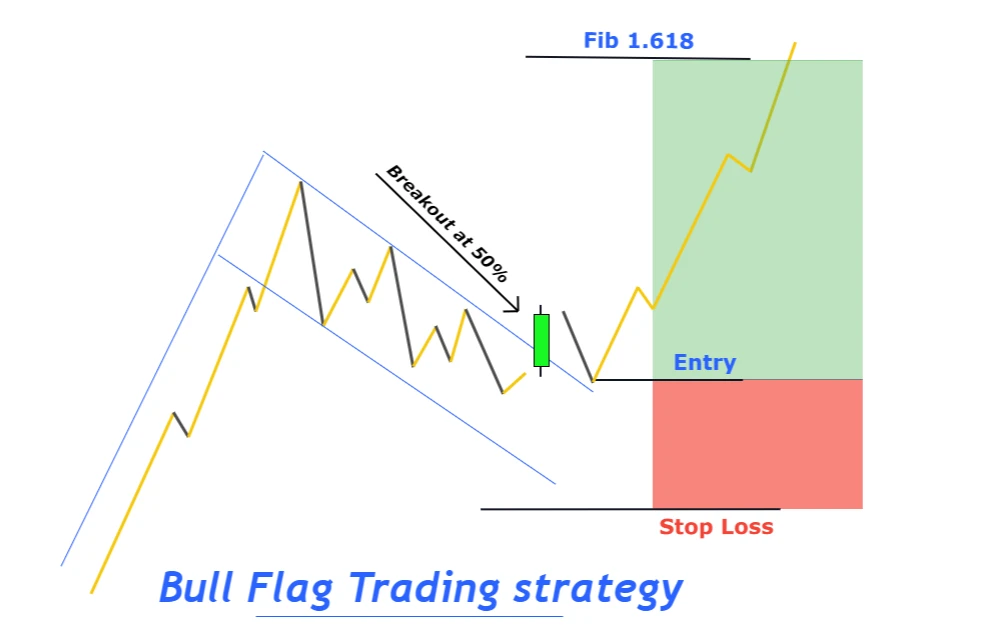
A Bullish flag Pattern is a technical analysis chart pattern that occurs in an upward trend and is characterized by a period of consolidation after a sharp price move up.
The pattern is created by two parallel trend lines that form a “flag” shape and is considered a continuation pattern, indicating that the uptrend is likely to resume after the period of consolidation.
The flag is formed by the price moving sideways within the parallel trend lines, with the upper trend line serving as resistance and the lower trend line serving as support.
A bullish flag pattern is considered confirmed when the price breaks out above the upper trend line, signaling a potential continuation of the uptrend.
As with all chart patterns, it’s important to keep in mind that the bullish flag pattern is not a guarantee of future price movements and should be confirmed with other technical indicators.
Bearish Flag Pattern
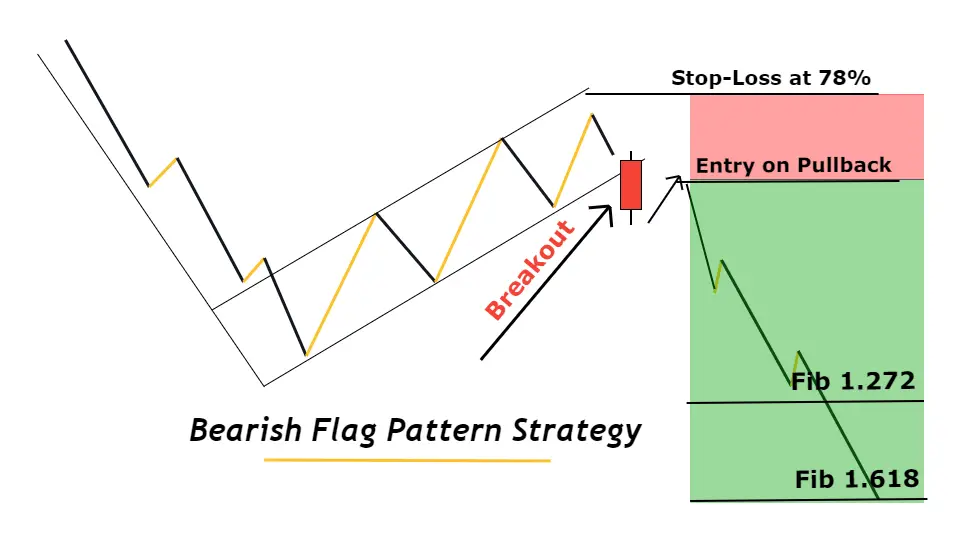
A Bearish Flag is a chart pattern that is often seen as a bearish reversal pattern in technical analysis of financial markets.
It is characterized by a downward sloping channel with lower highs and lower lows that is formed after a downward price move, or a downward trend.
The pattern is named a flag because it resembles a flag on a pole, with the downward trend acting as the pole and the channel representing the flag. Traders look to sell or short the security when the price breaks below the lower trendline of the flag pattern, expecting the downward trend to continue.