Today we’re going to talk about How To Trade Bullish Pennant Pattern And Bearish Pennant Pattern. we already described the Both the patterns so hope it will be more clear.
Bullish Pennant Pattern
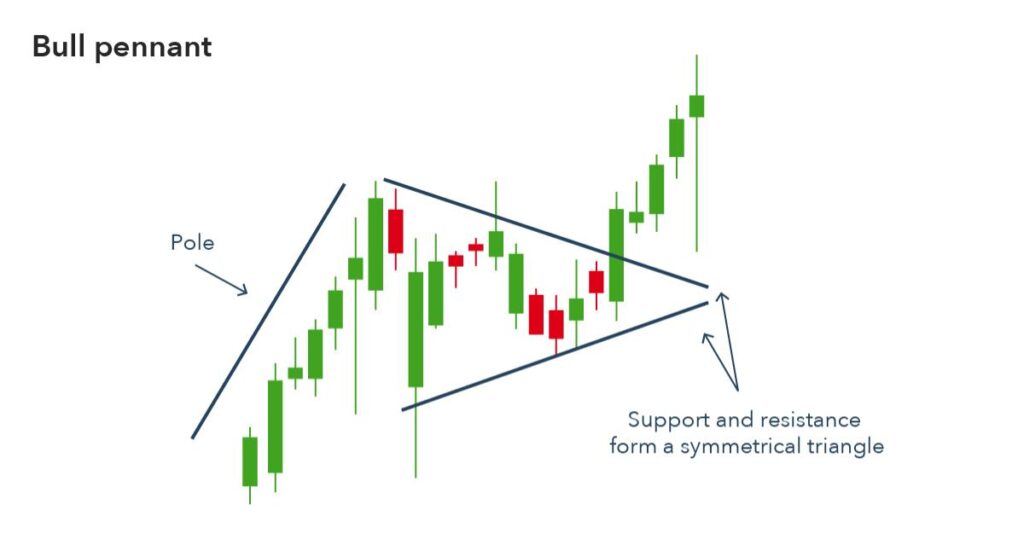
A bullish pennant is a technical chart pattern that forms when there is a significant price movement in an asset followed by a brief consolidation period.
The pattern is characterized by two converging trendlines that form a triangle shape, with the price of the asset oscillating within this triangle.
The converging trendlines in a bullish pennant indicate that the buyers and sellers of an asset are in a temporary equilibrium, but the momentum is likely to resume in the direction of the initial price movement.
The pattern is called “bullish” because it often indicates that the price of the asset is likely to continue its upward trend.
Traders often look for a breakout above the upper trendline of the bullish pennant as a signal to buy the asset, with a stop-loss order placed below the lower trendline.
The target price for the trade can be calculated by measuring the height of the initial price movement and projecting it upwards from the breakout point.
Bearish Pennant Pattern
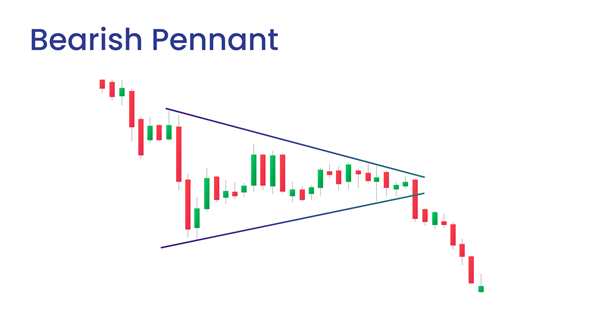
A bearish pennant is a technical chart pattern that appears during a downtrend in the price of an asset. It is formed by two converging trendlines that create a small symmetrical triangle or pennant shape.
The bearish pennant pattern is characterized by a significant price decline, followed by a period of consolidation where the price range narrows and volatility decreases.
The converging trendlines of the pattern form the boundaries of the consolidation phase, with the upper trendline acting as resistance and the lower trendline acting as support.
The bearish pennant pattern is considered a continuation pattern, indicating that the downtrend is likely to continue following the consolidation period.
Traders and investors may use this pattern to identify potential selling opportunities, with a stop-loss order placed above the upper trendline to manage risk.