Types of Candlesticks. today we are discussing types of candle sticks and their confirmations. which can be seen while Trading. This is just part 1 stay tuned for part 2 and Don’t forget to join us on Telegram.
Morning star & Evening star.
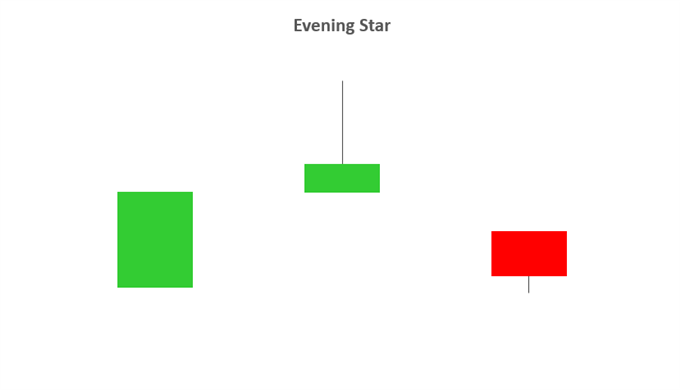
Evening and morning star candlestick patterns are seen at the end of up/down trends respectively and indicate reversal patterns.
The names come from the star shaped formation of the arrangement.
As you can see from the image below, the first candlestick is in the direction of the trend, followed by a bullish or bearish candle with a smaller body. The third candlestick is seen in the direction of the reversal, ideally the close passing the halfway point of the first candlestick.
Trading this candlestick pattern will require a confirmation candle in the direction of the relevant reversal – for example, traders will look for a bearish candle after the evening star.
Bullish Engulfing & Bearish Engulfing
Candlesticks indicate the Reversal of a Trend.
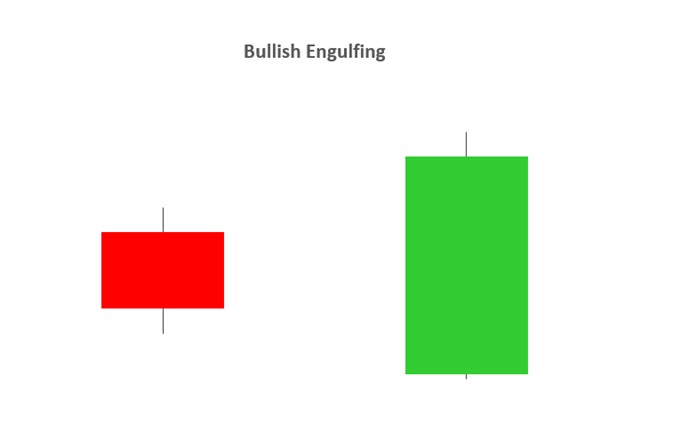
Bullish engulfing
The market should be in a clearly defined downtrend, not a sideways consolidation. The first candle is the color of a short-term trend (down) or doji. The color of the reversal (above) is the second candle. The body of the second candlestick covers the body of the previous one. Ignore the vixen (shadow). A stronger signal occurs when the body of the candle covers the body of 2 or 3 previous candles.
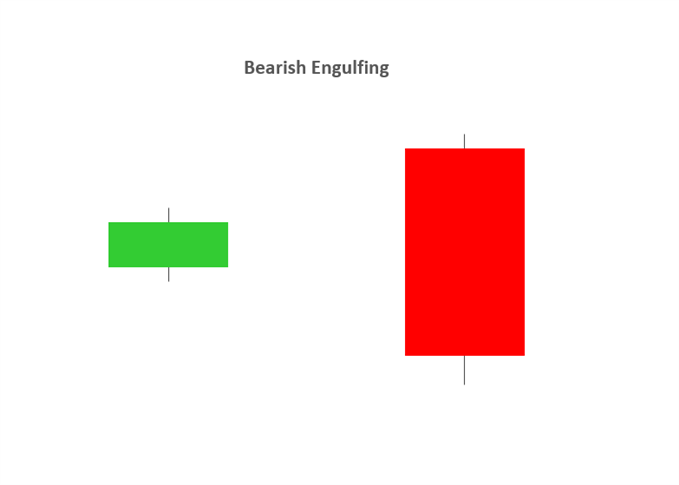
Bearish Engulfing
The market should be in a clearly identifiable trend. The first candle is the color of a short-term trend (upward) or doji. The second candle is the opposite color (below). The body of the second candle surrounds the body of the previous candle. Ignore the vixen (shadow). The size of the wrapped candle body does not matter. A strong signal is obtained when the body of 2 or more candlesticks is covered by the body of one candlestick.
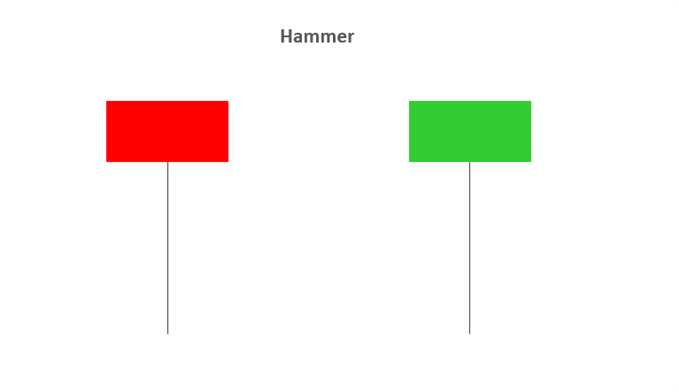
A hammer candle is seen as a bullish reversal that usually occurs at the bottom of a downtrend.
This candlestick pattern consists of a small body with an open, high, low, and close that are roughly equal. Below the body is a long lower wick that should be twice the length of the candle body. Body can be bullish or bearish, although bullish is considered more favorable.
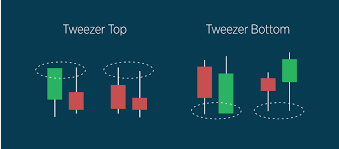
Tweezer Top:
Two or more candles with matching tops. They may be composed of real bodies, wicks (shadows), and/or dojis. This happens on consecutive or adjacent candles.
Tweezer Bottom
Two or more candles with matching bottoms. They may be composed of real bodies, wicks (shadows), and/or dojis.
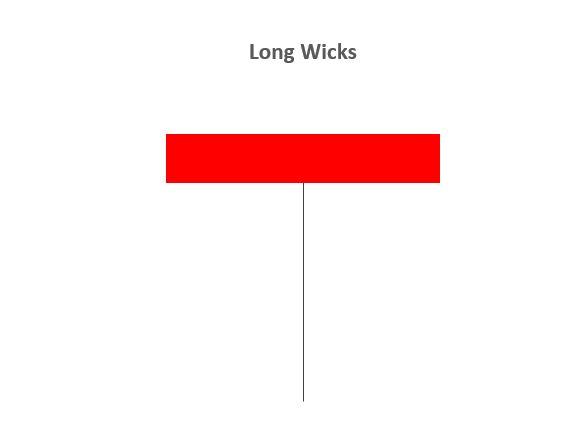
Long wicks
Long wick candlestick patterns often indicate a trend reversal. Long wicks occur when prices are tested and then rejected. Watt shows rejected values. Recognizing the trend is important for interpreting the significance of a long wick. Identifying key levels and price action is often used with long wick patterns.
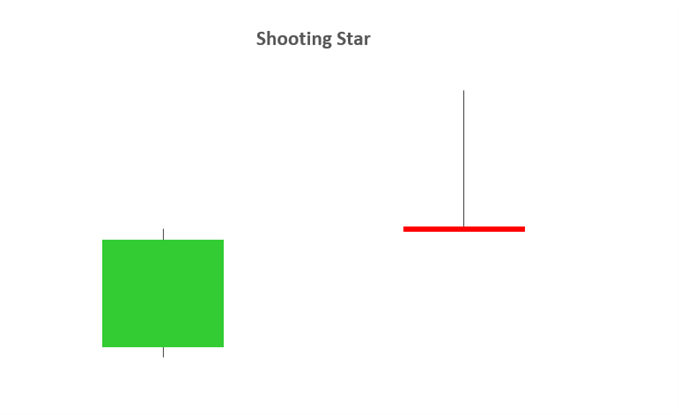
Shooting star
A shooting star is a bearish candle with a long upper wick, low or low, and a short real body near the low of the day. It follows an uptrend and potentially indicates a trend reversal to the downside.
A shooting star occurs after an advance and indicates that the price may fall.
The formation is bearish as the price attempted a significant rally during the day, but then the sellers took over and pushed the price back to the open.
Traders usually wait to see what the next candle (period) does after the shooting star. They can sell or short if the price falls during the next period.
If the price rises after the shooting star, the formation may be a false signal or the candle is marking a potential resistance area around the price range of the candlestick.