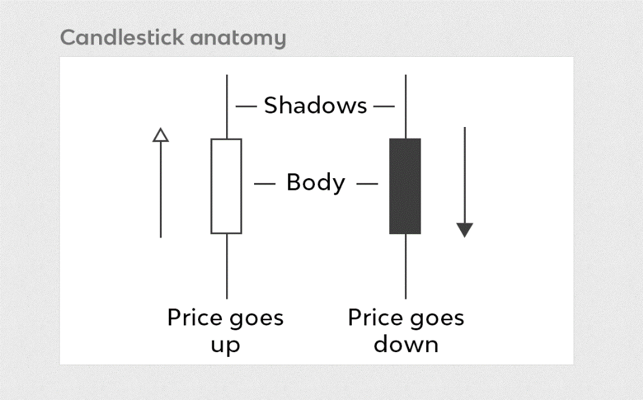
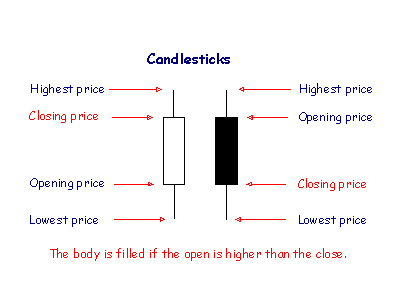
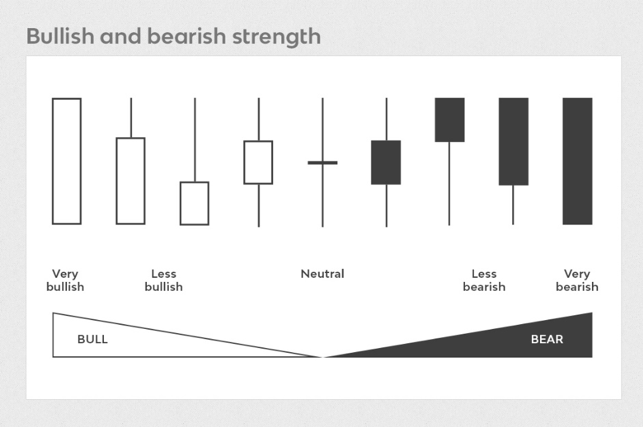
Visualization Technique in TradingBy aviradigitalmarketing / August 25, 2022 Visualization technique in Trading. Today, we are talking about the Visualization technique.view candlesticks bodies as armies:Bulls are marching UpBears are marching DownIf they march a lot they’re a strong army with a lot of staminaIf they march a little bit they’re less strong, but a successful march nonetheless. CANDLESTICKS: RELATIVE SIZE OF THE WICKS wicks are like fallen soldiers on the battlefield. These are the soldiers who tried to march into enemy territory but failed.From the above image, you can see an army of bulls has gone up and backed down and pushed up again gaining a Victory.This indicates a high degree of volatility.It also makes the candle a bit more neutral as the bears managed to push through the lows even though the bulls moved up.IMPORTANTIf the wicks are large compared to the size of the body, we give more importance to the wick.If the body is large relative to the size of the wicks, we give more importance to the body. Wicks above and Wicks below Wicks above are Fallen bull soldiers or bearish wicksWicks below areFallen bear soldiersbullish wicksSUMMARY OF WICKSLarge wick: Represents fallen bears Very uncertainlots of movementSmall wick: less of Battle going onLittle uncertain Less movement