What are Elliott Wave Triangles ?
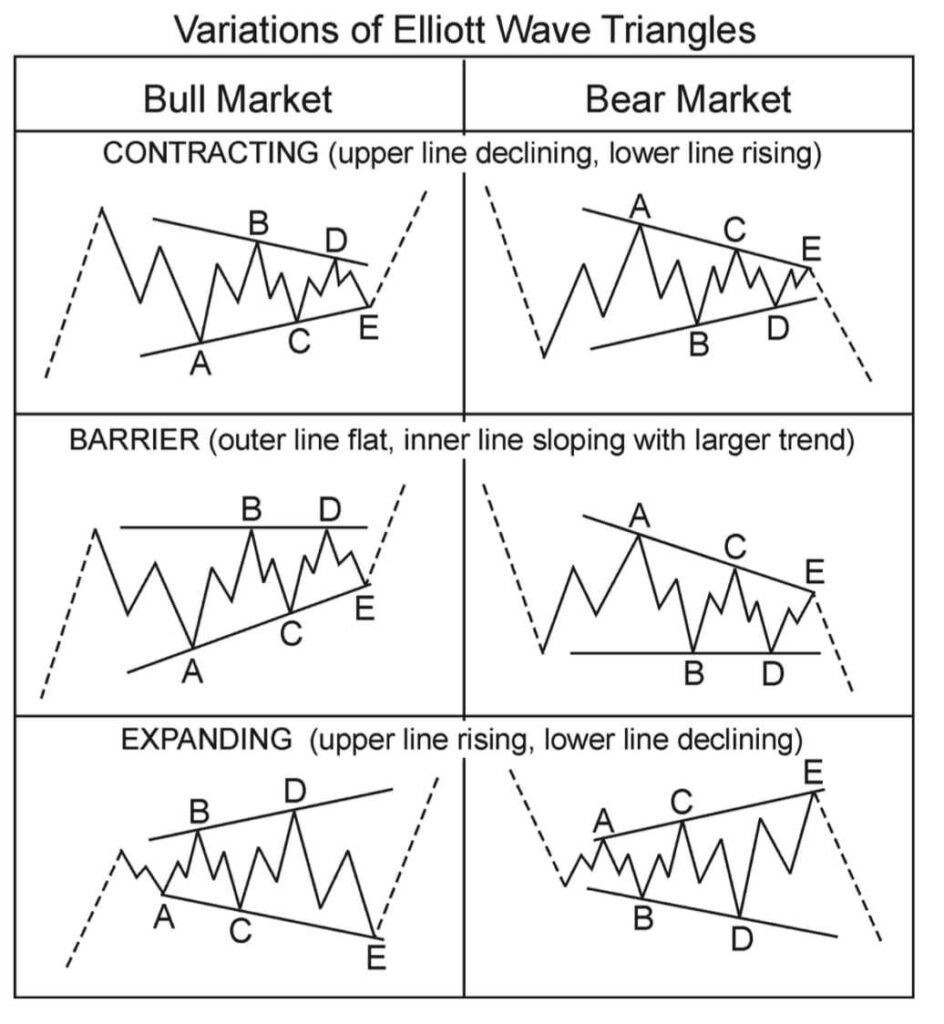
Today, we’re Discussing What are Elliott Wave Triangles ? Their all types and how to trade them. Elliot wave triangles are Divided into two Categories Bull & Bear.
Elliott Wave Triangles ?
Elliott Wave Triangles are one of the most common corrective patterns in Elliott Wave Theory. They are characterized by a narrowing range between two converging trendlines, and are typically labeled as either contracting or expanding triangles based on whether the trendlines are converging or diverging. There are several variations of Elliott Wave Triangles that traders and analysts should be aware of:
1- Ascending Triangle
This is a contracting triangle where the upper trendline is flat, while the lower trendline slopes upward. This pattern is typically seen as a bullish continuation pattern, as it suggests that buying pressure is gradually building up.
2- Descending Triangle
This is a contracting triangle where the lower trendline is flat, while the upper trendline slopes downward. This pattern is typically seen as a bearish continuation pattern, as it suggests that selling pressure is gradually building up.
3- Symmetrical Triangle
This is a contracting triangle where both trendlines converge at the same angle. This pattern is typically seen as a neutral continuation pattern, as it suggests that the market is in a state of balance between buying and selling pressure.
4- Expanded Flat
This is an expanding triangle where the waves b and c of the pattern overlap. This pattern is typically seen as a correction within an overall uptrend, and is considered a bullish pattern.
5- Running Flat
This is an expanding triangle where wave b extends beyond the start of wave a, while wave c ends beyond the end of wave a. This pattern is typically seen as a correction within an overall downtrend, and is considered a bearish pattern.
6- Double Three
This is a combination of two corrective Elliott Wave patterns, typically consisting of a zigzag followed by a contracting or expanding triangle. This pattern is typically seen as a complex correction within an overall trend, and is considered to be more difficult to interpret than a simple Elliott Wave Triangle.


