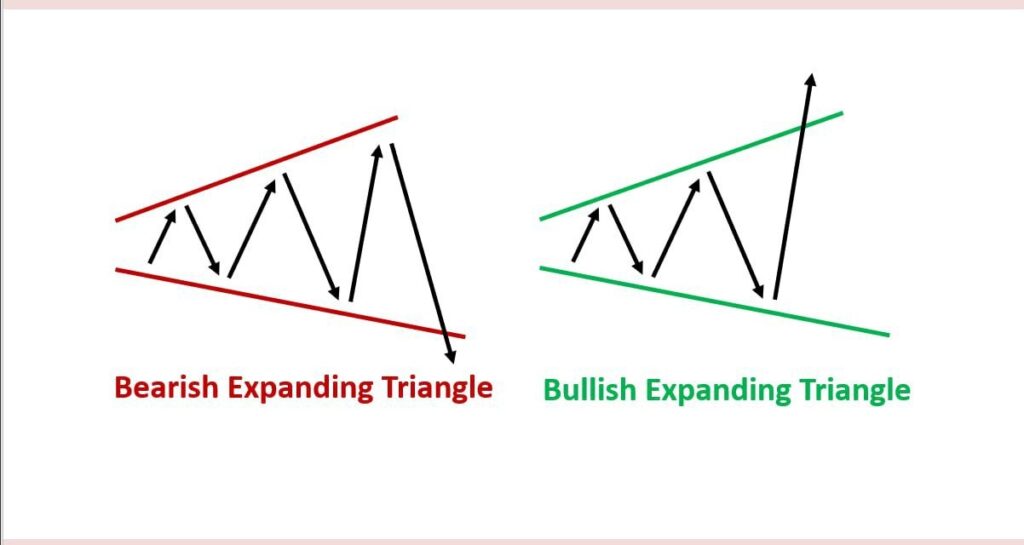
What is Bullish and Bearish Expanding triangle pattern and How to trade them ?
Today, we’re goin to Discuss What is Bullish and Bearish Expanding triangle pattern and How to trade them ?
Expanding Triangle Pattern
An expanding triangle pattern is a technical chart pattern often seen in financial markets. It’s a type of triangle formation that occurs when both the upper and lower trendlines of the triangle are slanting away from each other. In other words, the price range between the highs and lows of the pattern expands over time.
This pattern indicates a period of increased volatility and indecision in the market. Traders and analysts interpret the expanding triangle as a potential sign of uncertainty, as the price is making higher highs and lower lows within a widening range. This suggests that both buyers and sellers are becoming more aggressive but are still not able to establish a clear trend direction.
Expanding triangles can be found in both bullish and bearish contexts, and they are often considered continuation patterns, meaning that they are likely to continue the prevailing trend before the pattern formed. However, since the pattern signals increased volatility and uncertainty, traders often approach it with caution and may wait for a clear breakout above or below the trendlines to confirm the direction of the next move.
In summary, an expanding triangle pattern is characterized by its widening price range between ascending and descending trendlines, indicating growing volatility and uncertainty in the market.


