Today we’re going to talk about What is Moving Average Convergence Divergence and How to use it?
The Moving Average Convergence/Divergence indicator is a momentum oscillator primarily used to trade trends. Although it is an oscillator, it is not typically used to identify over bought or oversold conditions. It appears on the chart as two lines which oscillate without boundaries. The crossover of the two lines give trading signals similar to a two moving average system.
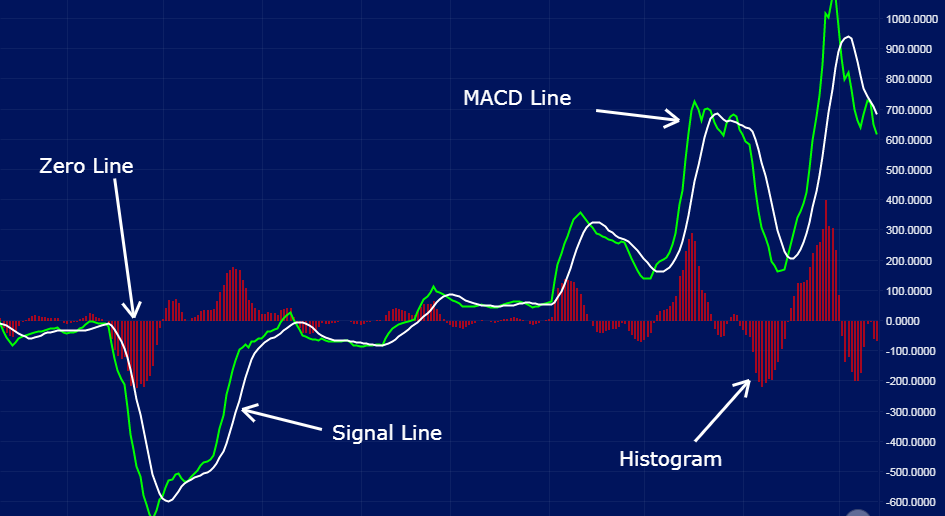
MACD stands for Moving Average Convergence Divergence is a momentum indicator used by technical traders that calculates the interconnection between 2 EMA (Exponential Moving Averages). In MACD (Moving Average Convergence Divergence) there is fast EMA (Exponential Moving Average) of length 12, slow EMA of length 26, and a single line of length 9 by default in general. There is also a graph looking thing called histogram which is the difference between the MACD (Moving Average Converging Divergence) line and Single Line.
Calculation
MACD Line = 12 periods EMA (Exponential Average) – period 26 EMA Moving
Single Line = 9 period EMA (Exponential Moving Average)
Histogram = the difference MACD Line and Single Line
How to use it?
Usually, traders use its crossovers for buy/sell or entries/exits, but standalone using MACD (Moving Average Converging Divergence) is not a good idea. Use it with some kind of strategy.
When the MACD line (Blue color) crosses over Single Line (Red color) below the histogram then its a buy signal and when Single Line (Red color) crosses below the MACD Line (Blue color) above the Histogram, then it’s a sell signal.
Note: Crossover may happen anywhere and anytime which can be a false signal also.
As you can see, we may get some beautiful swings with this but not always work and give false signals combine with some sort of strategy to increase accuracy.