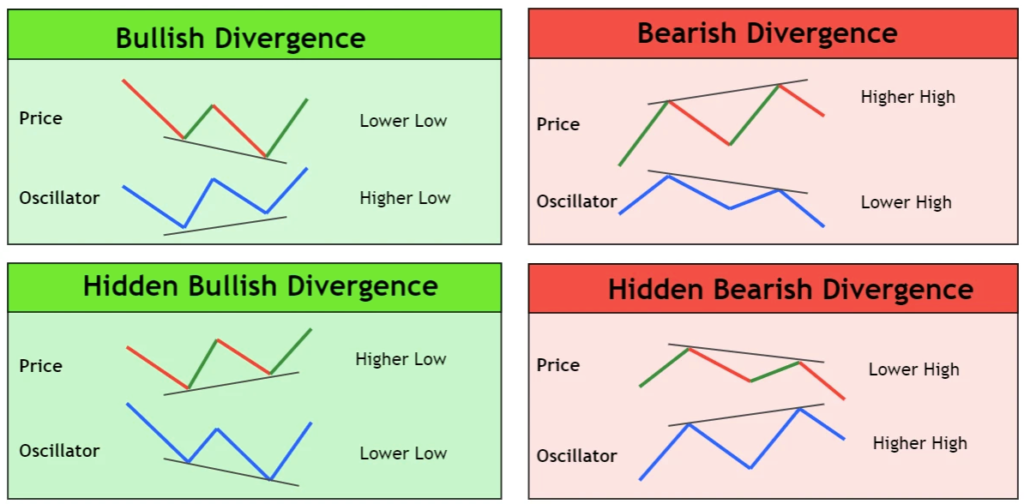
Today we are going to talk about What is Relative Strength Index Divergence? There are mainly two types of divergence 1, Bullish divergence 2, Bearish divergence . here, we had mentioned the steps regarding how we can trade divergence.
Relative Strength Index Divergence
RSI (Relative Strength Index) Divergence is used by price action traders to enter or exit in any trade. An RSI Divergence is created when RSI (Relative Strength Index) line diverges the momentum of the market or we can say opposes the price with respect to RSI (Relative Strength Index).
When the price is making Higher High but in RSI (Relative Strength Index) making lower low or price making Lower Low or RSI (Relative Strength Index) making Higher High can be said to be a divergence. There are 2 types of divergence:

Bullish Divergence
Bullish Divergence occurs when price making continuous lower low with respect to RSI (Relative Strength Index) making a higher high, then it’s called Bullish Divergence. Remember trade divergence when you see market-making swings with high momentum otherwise sometimes false divergence occurs.
Price making lower low but RSI (Relative Strength Index) going down (Making Higher high).
A bullish divergence is the pattern that occurs when the price falls to lower lows, while the technical indicator reaches higher lows. This would be seen as a sign that market momentum is strengthening, and that the price could soon start to move upward to catch up with the indicator.
Bearish Divergence
Bearish Divergence occurs when the market making a higher high with respect to RSI (Relative Strength Index) making a lower low is said to be Bearish Divergence.
Price making higher high with respect to RSI (relative strength index) making a lower low.
A bearish divergence is the pattern that occurs when the price reaches higher highs, while the technical indicator makes lower highs. Although there is a bullish attitude on the market, the discrepancy means that the momentum is slowing.


