What is Symmetrical triangle pattern in trading ?
Today we’re going to Discuss What is Symmetrical triangle pattern in trading and how to trade it.
Symmetrical triangle Pattern
A symmetrical triangle pattern is a chart pattern that can be found in the price action of a security.
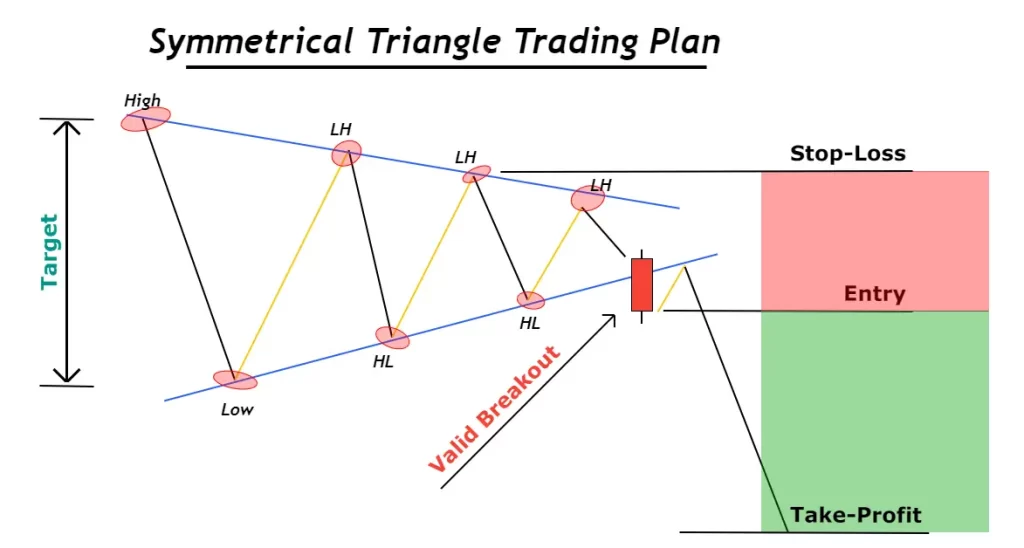
It is characterized by two converging trendlines, one of which is a descending resistance line, and the other is an ascending support line.
The pattern forms as the security’s price continues to make lower highs and higher lows. The converging trendlines create a triangle shape, hence the name symmetrical triangle pattern.
The pattern is considered a neutral pattern, and it can be a sign of consolidation or indecision in the market.
Traders may expect a resolution in either direction, with a breakout in either direction signaling a potential trade opportunity. If the price breaks out above the resistance line, it could be a bullish signal and indicate a potential long position. On the other hand, if the price breaks out below the support line, it could be a bearish signal and indicate a potential short position.
It’s important to wait for the pattern to be confirmed by a price breakout before acting on any potential trade signals.
Traders may also consider using stop-loss orders or other risk management strategies to limit potential losses.
Additionally, it’s always important to consider other technical and fundamental factors before making a trading decision.